The key to succeeding in retail arbitrage is making profitable purchases. That’s why Keepa is my number one Amazon FBA tool for evaluating a product. Looking at Keepa graphs can be a bit confusing when you start. In this Keepa tutorial, I’ll walk you through how to use Keepa for Amazon FBA, explain the benefits of the premium plan, and compare the Keepa extension versus the app.
If you want to see the Keepa screens while I use this tool, check out the YouTube version of this post.
What is Keepa?
Keepa provides a detailed pricing and rank history for almost every product on Amazon.com. This information helps you decide whether purchasing a product for your retail arbitrage business will sell and make a profit. You can use the Keepa extension for your browser, or the apple or android apps.
Free vs. Premium Plans for Keepa
Keepa is a free tool, but also offers a premium subscription with more data.
Keepa Free Plan
Cost: $0
On the free version, you can enter the product’s ASIN to get Amazon’s pricing history. This tells you whether Amazon sells the product and shows seasonal price fluctuations. However, you are limited in what you can see and research. An items sales rank history, for example, is not shown on the free version. The premium plan provides much more data to help you make an informed purchase decision.
Keepa Premium Plan
Cost: 19 € / month (approximately $22 USD / month)
Is a premium Keepa plan worth it? Yes, it is definitely worth the purchase. The number of products you can search per day with the premium plan is nearly unlimited – up to 10,000 ASINs per day.
In addition to the Amazon historical pricing graph, Keepa premium provides graphs for 3rd party FBA, 3rd party FBM, Sales Rank History, Buy Box Data, Offer Counts, Rating & Review Count, and eBay New & Used. The premium plan also includes dozens of other features and data points, like price increase alerts.
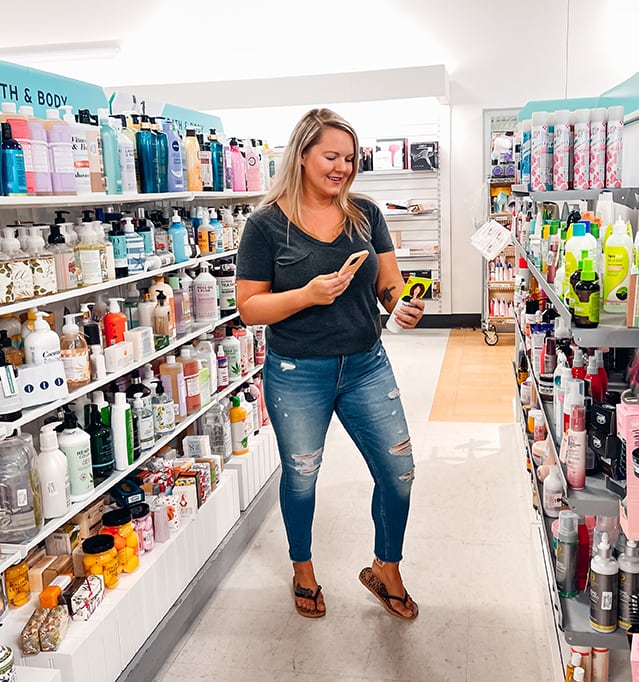
How to Use Keepa in the Store
Using Keepa in the store is easy. As I scan items using the Amazon Seller App, if I want to check a product’s pricing history, I copy the ASIN from the seller app and search it in Keepa. I use Keepa for about 20% of the products I scan. If I scan an item and the profit seems too good to be true, that is a scenario when I will double check the pricing history on Keepa. This how how to use Keepa to primarily answer these three questions:
Was Amazon selling it, have they sold out, and for how long?
The first thing I check is the orange line that shows if Amazon is or was ever selling it. It is my personal preference to not sell an item if Amazon is also selling it because I want to flip my inventory quickly and don’t want to fight Amazon for the sale. They are also less likely to give me the buy box.
I will also check if Amazon was selling it and it is now sold out. This scenario will trigger a price jump on FBA. If it appears to be temporarily sold out, I will not make the purchase. Amazon will likely restock the item and drive the price down. However, if it appears to be sold out for a few weeks or months, it will likely not come back into stock soon, so I will make the purchase.
What’s the product’s price history?
The 3rd party FBA and FBM lines will show the product’s pricing history over time. I am looking to see if the price is stable. If I seem to have scanned during a short-term price jump, I probably will not purchase the item. This is also a good way to check the pricing on seasonal items. If I scan a Halloween item in August, I can see what that product sold for during autumn of the previous year.
If a product is sold out, there won’t be much information on the Amazon Seller App. In this scenario, only Keepa has the historical pricing data, so I can check what it sold for while it was in stock.
What’s the product’s sales rank history?
If a scan seems too good to be true, you’ll want to check the historical sales rank. Sales rank changes constantly, so you will want to see if it is consistent before you make the purchase. For example, if an item you scanned was just sold, that could impact the rank in the Amazon Seller App.
Example of how to use Keepa
For example, I scanned a $2 toothpaste, and it showed it was selling for $15 on Amazon. This profit seemed too good to be true, so I checked the historical data on Keepa. Keepa confirmed that the toothpaste consistently sells at that price, and Amazon has never sold it. I confidently purchased this great find!
I always use Keepa for seasonal items. These products are great buys, but the price is always fluctuating. Keepa will tell me the price last season, and the time period when the product is most profitable.
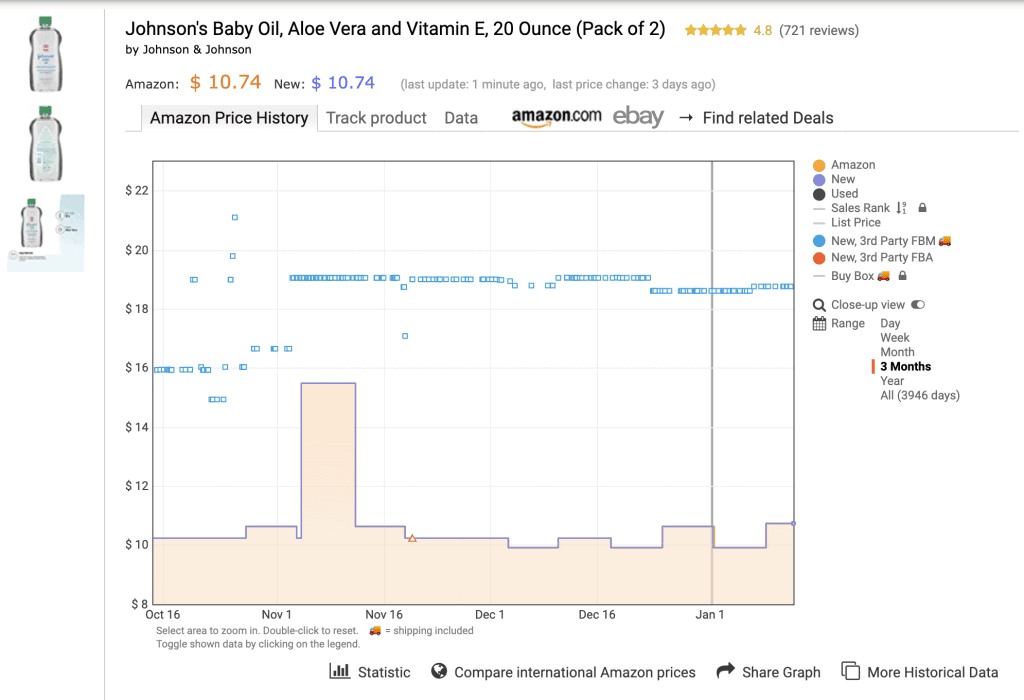
How to Use Keepa Graphs
Keepa provides a lot of information. Focus on just the information you need to expedite your evaluation. Here are the data lines I use the most:
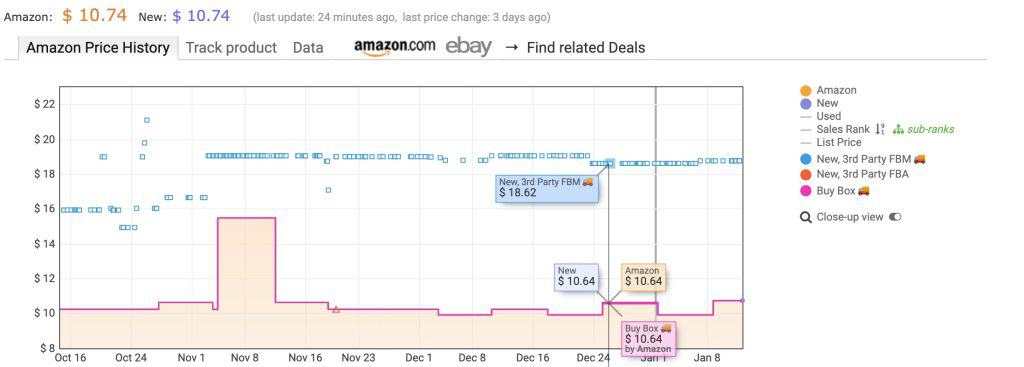
- Amazon (yellow in the top graph): price history when Amazon is the seller
- Sales rank (green): the sales rank over time
- New 3rd party FBA (red triangles): price history when fulfilled by Amazon third party sellers (like myself) sold the item
- New 3rd party FBM (blue squares): price history when fulfilled by merchant third party sellers sold the item
These data points will answer the three questions from above: Is Amazon selling it? What’s the price history? What’s the sales rank over time?
Here is the rest of the information on the first graph, which you may find helpful
- New (purple): price history when the product is new
- Buy box (pink): history of the buy box price
The second graph shows the sales rank over time. We only care about the rank of the main category. The rank of the subcategory is not relevant.
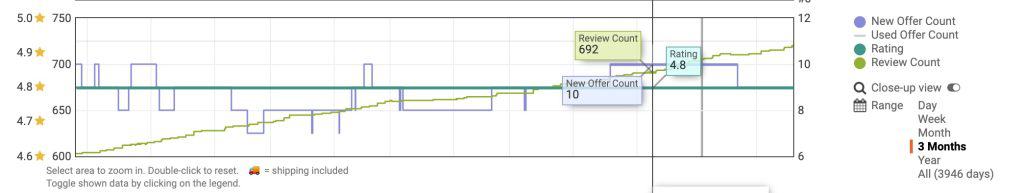
The third graph shows the new offer count, rating, and review count over time.
- New offer count (purple): This is helpful if you’re checking for possible IP issues. If there is only one offer, that indicates there may be IP issues with the product. If there’s multiple you’re probably safe.
- Rating (dark green): This is the customer rating out of 5 over time. This is a good indicator of an item’s quality, especially if it’s a new item.
- Review count (light green): This is the number of reviews for the product over time, another quality indicator.
Other helpful Keepa information and features
- If you click the Amazon logo at the top you can see the customer facing Amazon listing page for the product. This is helpful to check item details like quantity or variations.
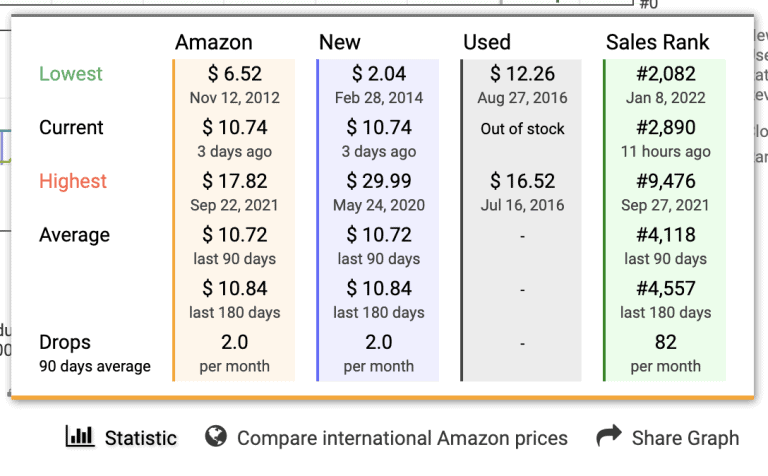
- Hover over the “statistics” button below the graphs to see the high, low, current, and average prices. It will also show the number of price or rank drops per month. Remember a drop could indicate a price drop (not good), not necessarily a rank drop (which would be good). It will also show when the product had its best or worst sales ranks, which is helpful.
How to Use Keepa to Evaluate a Product’s Profitability
As you can see, knowing how to use Keepa is fundamental to ensuring I purchase profitable products. Evaluating your buys is the most challenging part of a retail arbitrage business. If you need more guidance for making purchase decisions, I recommend my Amazon Selling Course: Beginner FBA.
So that’s how to use Keepa! I hope you found this Keepa tutorial helpful. It’s not hard, as long as you understand the graph. Don’t forget, you want to use Keepa to learn these three things: whether Amazon is selling the item, price history, and sales rank over time.
If you want to learn about other helpful retail arbitrage tools, read my blog “15 Amazon FBA Tools To Take Your Retail Arbitrage Business to the Next Level.”
Video Keepa Tutorial
Check out the video version of how to use Keepa: